EUAN HAM
euanham/projects/recipeRec.md
Recipe Rec
F25 | Final Report | Developed for CS 4641 @GaTech
This is a shortened version of the final report produced for 4641: Machine Learning @ Georgia Tech. I will primarily be talking about features I implemented for the project: preprocessing, K-means, and CNN.
The growth of digital food platforms has produced countless recipe data. While recipe recommendation systems exist, many focus on popularity or simple collaborative filtering, neglecting pantry availability, diet, or sustainability. Recent research has shown the potential of machine learning methods for recipes.
We used the Food Ingredients and Recipes Dataset with Images. The first dataset contains a CSV file with 13,582 rows with each row containing the columns of index, ingredients, recipe name, image name. There is also a folder with the respective images corresponding with the image name column. The second dataset featured over 230,000 recipes with ingredients lists and approximate nutrition ~1.1M user ratings. The third dataset is a CSV file containing around 2 million products with their respective Nutri-score and Eco-score.
For Foods Ingredients and Recipes Dataset with Images, we normalized ingredients by removing numbers and other descriptors, extracted quantities, lemmatized/fuzzy matched, and preprocessed images to ResNet50 requirements. For Food.com's dataset, we did the same preprocessing as the previous data set for text data. Finally, for the OpenFoodFacts, there were a lot of N/A values which were filtered out.
K-Means
Here K-Means is combined with features like TF-IDF cosine similarity, pantry coverage, and sustainability score into one score based on weights. We use K-means on TF-IDF features to cluster into 20 recipes. The recommendation system combines the metrics mentioned above to produce a list of top-N recipes for the user.
The first metric is TF-IDF similarity, utilizing cosine similarity between the user’s pantry (bag-of-ingredients) and each recipe’s TF-IDF vector. The 2nd metric is cluster affinity which compares the pantry to cluster centroids. Next, we look at pantry coverage which looks at the percent of the normalized ingredients in the candidate recipes. This supports the main ethos of sustainability, as users can just use ingredients they already have. Then we have a complexity penalty. For example, recipes with ingredient lists of 3 or less get downranked as those are probably just things like sauces which are not desired for cooking. Finally, we look at sustainability where total recipe emissions (kg CO2e) become transformed with an inverted equation: score = 1 / (1 + emissions) such that lower emission recipes get higher scores.
The final score is a weighted sum of TF‑IDF similarity, pantry coverage, cluster score, and the sustainability score with default weights of 0.3, 0.3, 0.2, 0.2, respectively. This model preserves relevance while also accounting for practicality and environmental impact. The top-k results are returned with their respective scores.
CNN
This model recommends recipes by analyzing food images and computing visual similarities between them using convolutional neural networks. Rich features of food images are extracted for content-based recommendations without relying on text.
The model is built on a pretrained ResNet50 architecture, extracting 2048-dimensional image embeddings. Standard preprocessing is done including resizing to 224x224 pixels, RGB conversion, and normalization. The embeddings then carry information about the food images such as appearance, texture, color, and presentation.
At recommendation time, cosine similarity is computed between the image embeddings and the queried image. The top-N most visually similar images are returned after being ranked. This allows dish recommendation to be based on recipes that look similar to the user’s queried image, promoting recipes that can be created using similar ingredients as the user.
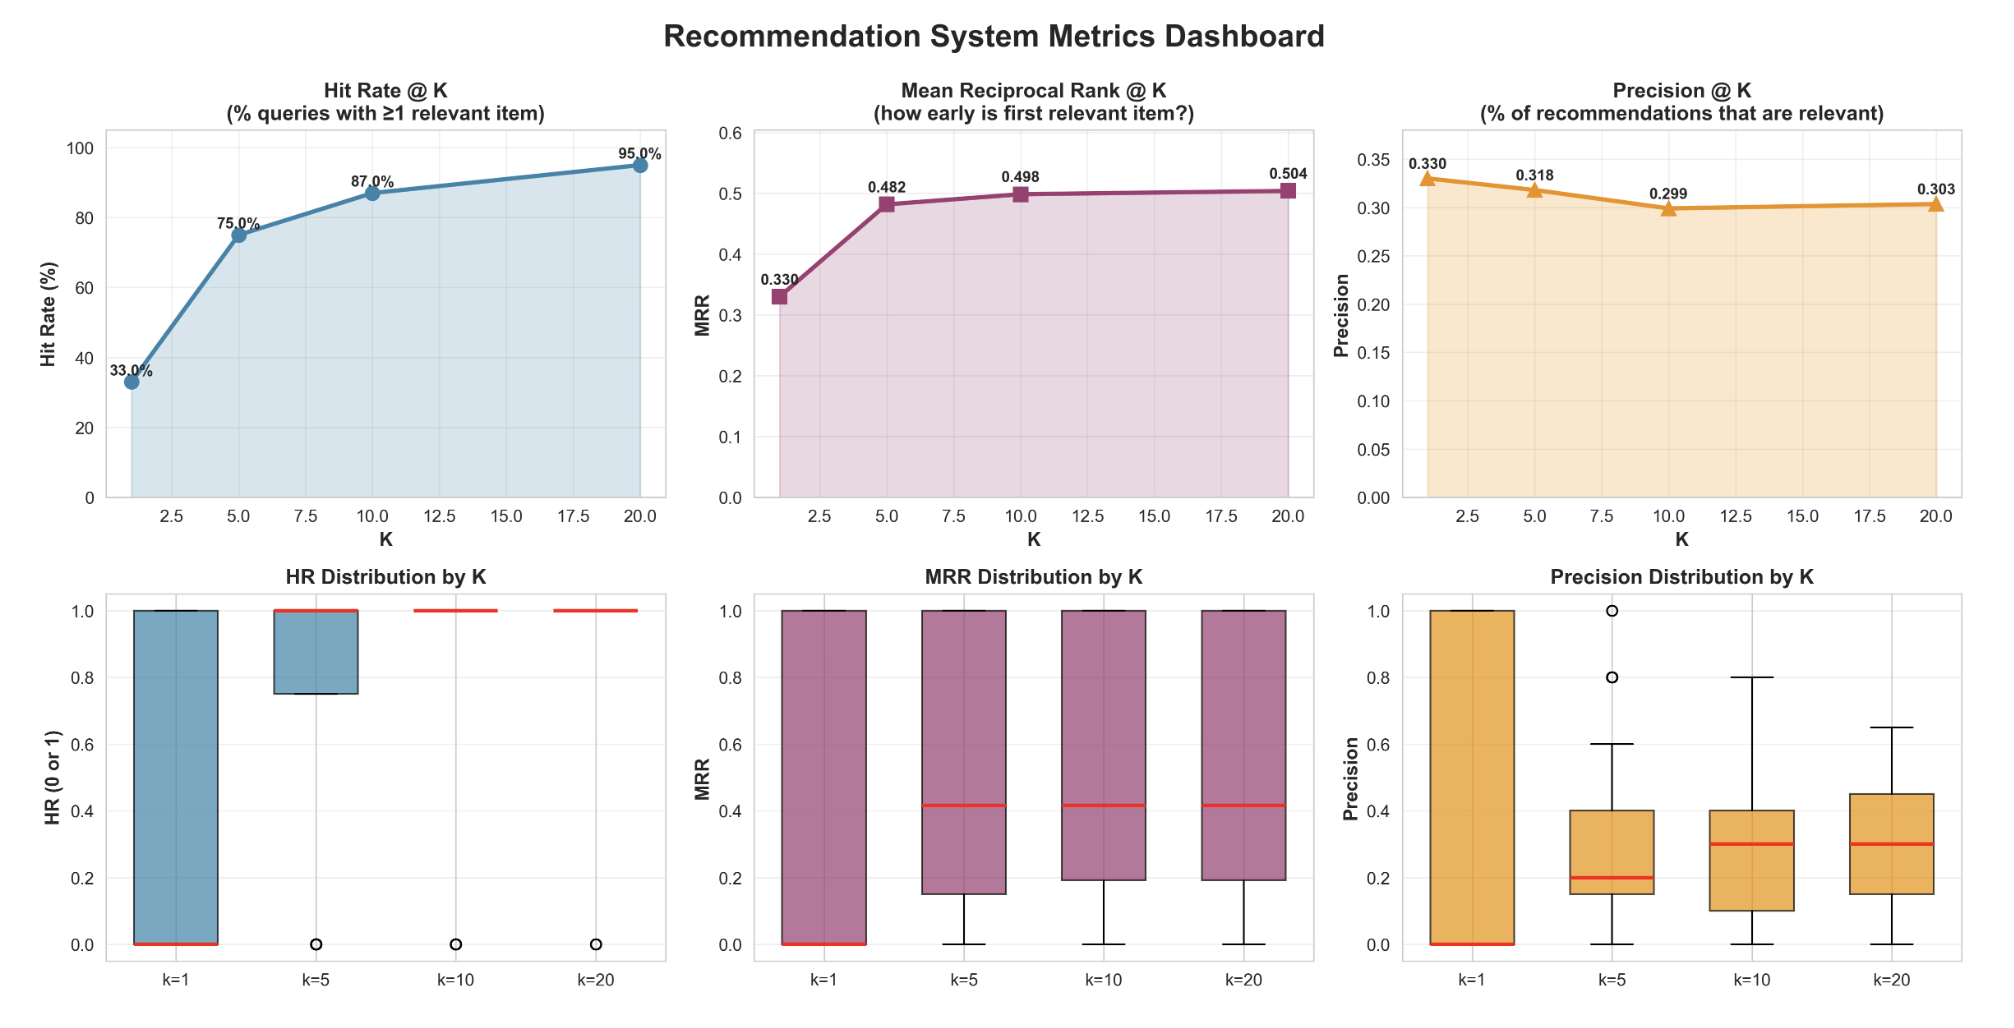
The model also includes quantitative evaluation metrics including hit rate@K, mean reciprocal rank@k, and precision@k. These metrics quantify if relevant results appear in the top k rankings, ranking quality, and recommendation accuracy, respectively.
K-Means Results
The K-Means model balances recipe relevance with sustainability. Elbow analysis shows that k=20 is optimal as the within cluster sum of squares decreases after after k=20. We also obtained a moderately positive silhouette score, 0.0106, with k = 20, indicating that clusters are reasonably cohesive but not strongly separated. This is a low score, but this is more of a characteristic of the dataset as recipes across different cultures will have similar ingredients such as rice or oil, for example. The model performed better than the baseline increasing pantry coverage from 68% to 80%.
Key limitations are parsing quantities for weight estimates, leading to incomplete carbon footprint data.
CNN Model Results
From the strong hit rate and mean reciprocal ranking at k = 10 of 91% and 0.490 respectively, strong practicality of the model is shown. The precision stabilizes around 31% across different list lengths. Additionally the system has persisting relevance from 29% at k = 1 to 94% at k = 20. With 92% neighborhood stability with noise perturbations, the embeddings show robustness under pressure which is reliable for real conditions. So the model captures visual similarity relationships for recipe discovery allowing users to find alternates to their queried dish even across other food groups.